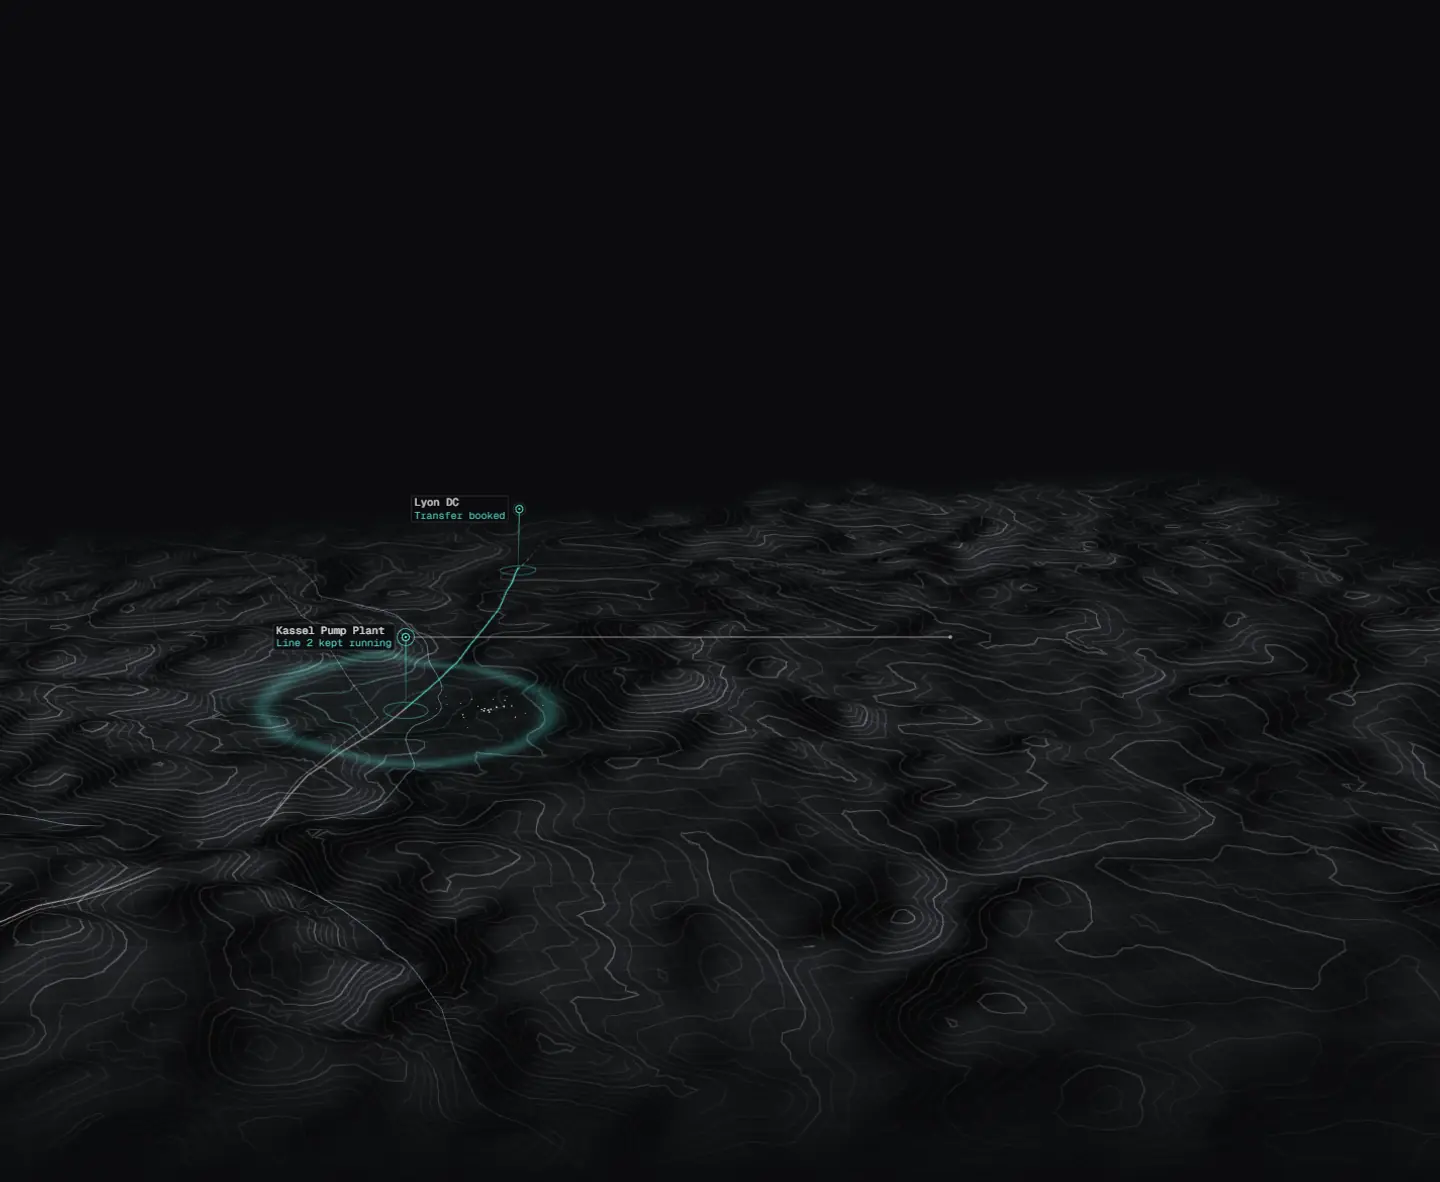
Illustration: a live map drawn as a wireframe of the real ground from the Elbe estuary to Kassel, with pins for sites and suppliers. In the example scenario with demo data, a vessel from Gothenburg to the Port of Hamburg reports a 3-day delay. Horizon follows the impact to bearings for Kassel Pump Plant, line 2, where safety stock covers 1.5 days, checks three sources and proposes pulling stock from Lyon DC. An incident goes to the inbound logistics team, who book the transfer and resolve it; write-back covers ServiceNow incidents only and is in beta. The team delivers 2,400 bearings from Lyon DC, and line 2 keeps running.
Your network, live.
Horizon is a live map of your sites, suppliers, routes and processes, connected to your systems and to what happens in the world. When a shipment slips, you see which plant and line it touches and get a proposal for your team to review.
One pass over the Halvard network
A screen recording of the demo tenant with live lenses on. The notes appear when the camera reaches the object they describe.
Add the signals that touch your network
Each lens puts one source on the globe, with its own legend, filters and data age. Turn on the ones that matter for a site or a route.
When a site has a problem, see who is on it
When an event hits a site, it opens on the map with its playbook. Assign the work to a role, a team or a person, see which running cases wait at that site, and follow the agent that tracks the parts.
- Field assignments you can reassign and replay on the time slider
- Live cases from your event logs, per process step
- Agent runs shown on the site they act on
Who takes the next step
- Field assignmentsSend a role, a team or a person to a location, reassign the work and replay it on the time slider.Live
- Operational eventsReport an event from the map, merge or reject duplicates, and dispatch it into a field assignment.Live
- Live cases at a siteRunning cases projected from your event logs, per process step and filtered to the location.Live
- Agent runs and map marksEach run shows its current step on the location it acts on. Marks an agent leaves carry its name.Live
- Playbook escalationAn event past its playbook threshold proposes a ServiceNow incident for a person to approve.Beta
- Disruption responseWeather and news open incoming reports with a decision due. Release checks are still open.Beta
- Governed work ordersA signed-off process will run its agent tasks as tracked work orders and stop at the human steps you modeled.Planned
Agents propose dispatches and incidents. Writes to ServiceNow or SAP go through the approval inbox first.
What Horizon does today
The current feature set of the Globe view, grouped by the job it does.
Map
- Sites, routes and flows on a 3D globe
- Flow status from your map data, with delayed and disrupted flows marked
- Saved camera views with a start view
- Time slider to scrub hours and days
- Custom regions you draw and edit
Live data
- Vessels from AIS and aircraft from ADS-B
- Weather channels (beta)
- World events from GDELT
- Satellite heat detections from NASA FIRMS
- Satellite passes for a selected satellite
Analysis
- Analyze a selection (beta): lasso an area or pick a saved region
- Port activity and pressure from public port data (beta)
- Energy exposure of your organization
- AI runs shown on the location they act on, with Review and Explain
Works with these public feeds
The live lenses read from these sources. Each one shows its data age on the map.
Live data feeds
6- Aircraft positionsADS-B · adsb.lolLive
- Ship positionsAISLive
- Weather and forecastsOpen-MeteoBeta
- News eventsGDELTLive
- Active firesNASA FIRMSLive
- Satellite orbitsCelesTrakLive
Horizon next to a static site map
| Static site map | Horizon | |
|---|---|---|
| Supply flows | Drawn by hand | From your map data, with status |
| Vessels and aircraft | Not included | Live lenses with data age |
| Weather and events near a site | Separate tools | Lenses on the same globe |
| Questions about an area | Export and filter by hand | Lasso the area and analyze the selection |
| Dispatch to a site | Not included | Field assignments next to the site's live cases |
| Shared views | Screenshots | Saved camera views |
Put your own network on the globe
Start with your sites and the flows between them, then turn on the lenses you need.